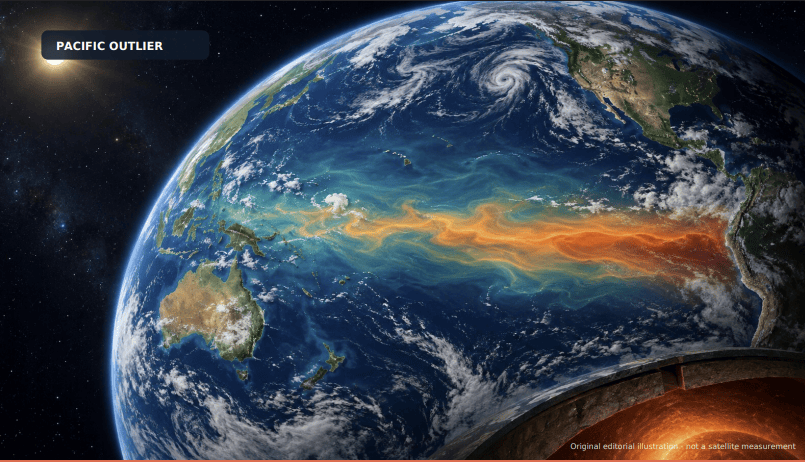
Record surface heat and a rapidly intensifying El Niño are reorganizing the climate system. The Sun and solid Earth tell a quieter—and scientifically useful—story.
The most consequential Earth-system news of the week did not arrive as an explosion, an impact, or a violent solar storm. It arrived in finalized datasets.
August 2026 was the warmest August in the modern global record. In the European Union’s ERA5 reanalysis, the average sea-surface temperature outside the polar oceans, from 60°S to 60°N, reached 21.07°C, or 69.93°F—the highest value recorded for August and effectively tied with March 2024 for the highest monthly value in that dataset. (1) NOAA’s independent analysis also placed global sea-surface temperature at a record high.(2)
At the same time, the tropical Pacific was shifting into a much more powerful state. NOAA now gives the developing 2026–27 El Niño a greater than 90 percent chance of becoming “very strong,” with a 75 percent chance that its three-month relative index will reach at least +2.5°C late this year. No El Niño in NOAA’s record since 1950 has crossed that threshold on this measure.(4)
Those are extraordinary observations. But the rest of the planet did not move in lockstep. Solar activity was mostly low. A minor geomagnetic storm passed quickly. Global earthquake activity showed no meaningful surge, and the world’s active volcano count remained within its familiar range.
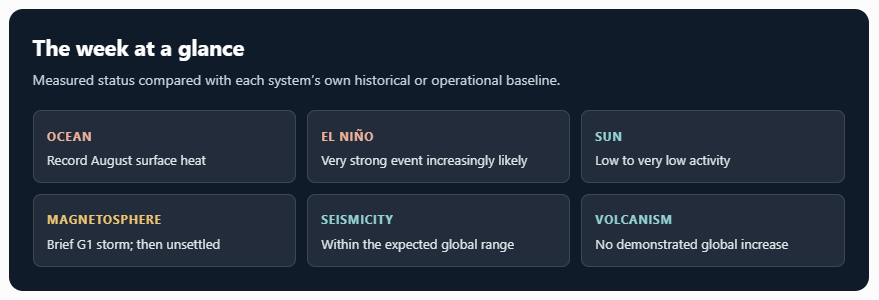
That contrast matters. It tells us where the strongest signal actually is: in the coupled ocean-atmosphere system, amplified by long-term planetary warming—not in a simultaneous disturbance spanning every layer of the Sun-Earth system.
A record written on the ocean surface
Copernicus calculated the global mean surface-air temperature for August at 16.96°C, 0.85°C above the 1991–2020 average and about 1.65°C above the estimated 1850–1900 preindustrial level. Within ERA5, it was not merely the hottest August; it was statistically tied with July 2023 as the hottest calendar month in the record.(1)
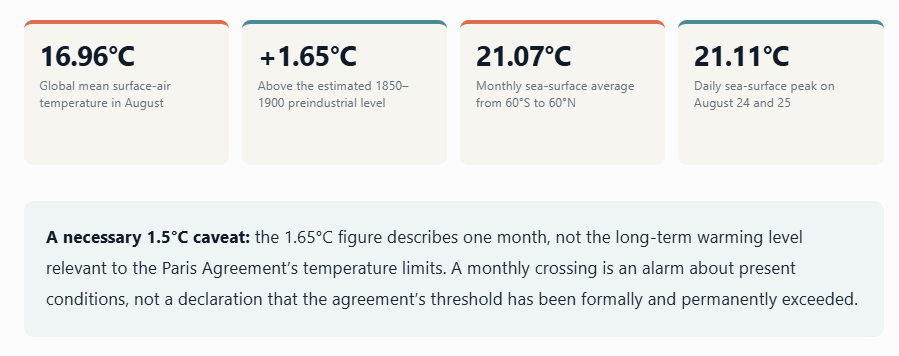
The ocean result is especially revealing because the ocean stores most of the excess heat accumulating in the climate system. ERA5’s daily average outside the polar oceans reached 21.11°C on August 24 and 25. Strong or severe marine heat waves covered parts of the central and eastern tropical Pacific, the Atlantic coast of Europe, and the western Mediterranean.(1)
There is an important measurement caveat. ERA5 estimates the temperature of the ocean’s upper “foundation” layer rather than reproducing every observational product in exactly the same way. Copernicus notes that the August monthly sea-surface record is not identical across all major datasets. NOAA, however, independently found a global sea-surface record in its own analysis. The methods differ; the broad signal does not.
Nor did every cryosphere indicator set a record. Arctic sea ice ranked 12th lowest for August in the satellite record, while Antarctic sea ice ranked fourth lowest. That mixed ranking is scientifically healthier than a story in which every metric is forced into the same dramatic frame. Earth’s systems are connected, but they do not all peak together.(1)
For Americans, the heat was not remote. NOAA found that the contiguous United States experienced its warmest August in a 132-year record, with an average temperature of 75.6°F—3.5°F above the 20th-century average. June through August was also the country’s warmest meteorological summer on record. By September 1, drought covered 59.1 percent of the contiguous United States.(3)
El Niño is no longer a background forecast
El Niño develops when unusually warm water spreads across the central and eastern equatorial Pacific and the overlying atmosphere responds. The trade winds, tropical rainfall belts, jet streams, and storm tracks begin to reorganize. It is not a local patch of warm water. It is a basin-scale change in the machinery that redistributes heat and moisture around the planet.
In August, NOAA measured a monthly anomaly of +1.8°C in the Niño 3.4 region, the zone most commonly used to track the event. Farther east, the Niño 3 region reached +2.5°C and Niño 1+2, near the coast of South America, reached +3.4°C. Below the surface, pockets of water more than 10°C warmer than average extended across parts of the equatorial Pacific. That last number is not a basin-wide surface anomaly; it describes exceptionally warm subsurface zones poised to help sustain the event.(4)
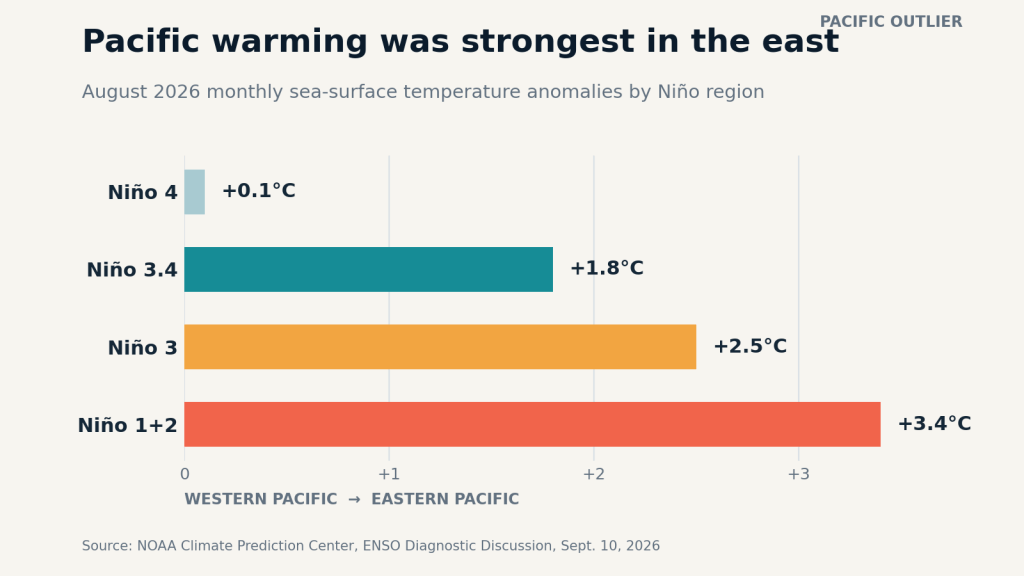
August warming was sharply concentrated toward the eastern equatorial Pacific. Source: NOAA Climate Prediction Center.(4)
The World Meteorological Organization expects El Niño to persist through the Northern Hemisphere winter and peak late in 2026.(5)Yet “very strong” does not mean that every familiar El Niño impact will occur, or that forecasters can attribute an individual hurricane, flood, drought, or heat wave to the event by inspection. ENSO changes probabilities. It does not issue appointments.
In the United States, strong El Niño winters often tilt the odds toward wetter conditions across parts of the southern tier and warmer conditions across parts of the north. The strongest effects commonly emerge from January through March. Water managers, farmers, energy planners, insurers, and public-health agencies should treat those shifts as planning information—not as a deterministic seasonal script.(10)
The Pacific-Atlantic contrast is already striking. Hurricane Lowell passed closest to Kauai and Niihau on the night of September 7, with its most damaging effects extending into September 8. The National Weather Service measured a 92 mph gust at Puu Lua and 21.11 inches of rainfall at Kilohana.(6) Kauai Island Utility Cooperative reported that roughly 33,000 of its 36,000 accounts were without power on the morning of September 8. (7)
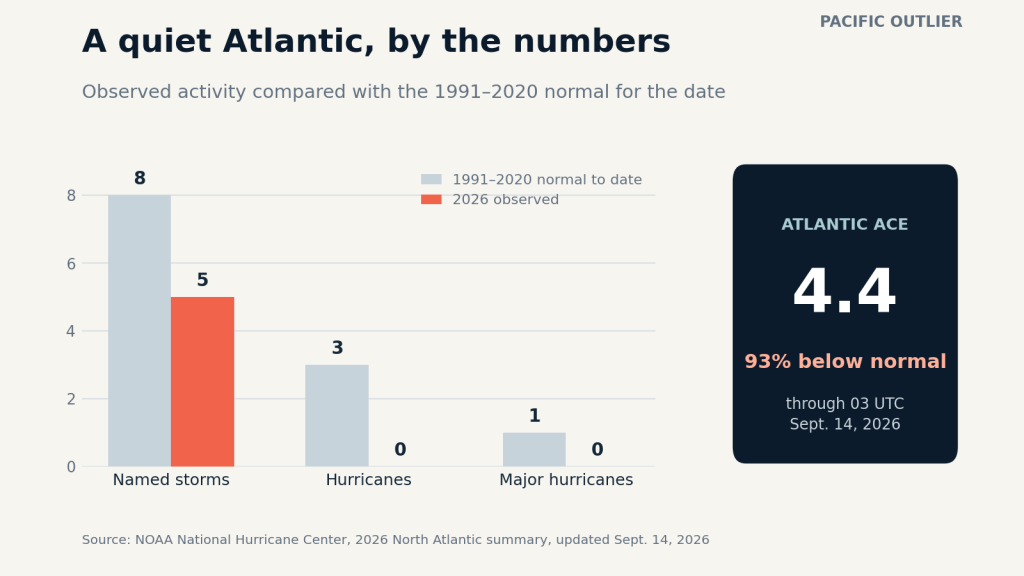
Across the continent, the Atlantic season was extraordinarily subdued. As of 03:00 UTC on September 14, the basin had produced five named storms but no hurricanes; accumulated cyclone energy was 93 percent below the 1991–2020 norm for that date.(8) El Niño tends to increase vertical wind shear over the Atlantic while favoring activity in parts of the Pacific, so the basin contrast is physically consistent with expectations. It is not proof that El Niño alone caused Lowell or suppressed every Atlantic storm. Ocean temperatures, atmospheric circulation, intraseasonal variability, and chance all matter.
The event is also sharpening risks beyond the United States. Copernicus Atmosphere Monitoring Service reported an intense start to Indonesia’s seasonal fires and warned that El Niño could enhance the dry conditions that make peat and vegetation easier to burn. Smoke from Indonesian fires can cross national borders into Malaysia and Singapore, turning a regional land-management and drought problem into a transboundary public-health hazard.(9)

The background warming trend raises the platform from which that natural cycle operates. A powerful El Niño on a warmer planet can therefore produce records more readily than a similar event did decades ago.(10)
The Sun flared softly; the magnetosphere answered normally
If this were a week of generalized external forcing across the Sun-Earth system, the space-weather record would be an obvious place to look for corroboration. It does not provide it.
NOAA’s Space Weather Prediction Center classified solar activity as low from September 7 through 10 and again on September 12 and 13, and very low on September 11. The largest flare in the reporting period was a modest C5.8 event on September 12. No M- or X-class flares occurred from September 8 through 14.(11)
Earth did experience an isolated G1, or minor, geomagnetic storm on September 8. The planetary Kp index briefly reached 5 as a high-speed stream from a coronal hole swept past Earth, possibly with weak material from an earlier coronal mass ejection embedded in the flow. Conditions then settled into the quiet-to-unsettled range through September 13. (11)
High fluxes of electrons above 2 MeV were observed from September 8 through 13, while energetic proton levels stayed near background. That combination is familiar in the radiation belts following high-speed solar-wind forcing. It matters operationally because energetic particles and geomagnetic disturbances can affect satellites, radio systems, navigation, and power infrastructure. But it is not evidence of an unidentified transfer of energy into Earth’s deep interior. The measured solar-wind conditions are sufficient to explain the measured magnetic response.
The solid Earth stayed within its noisy baseline
Earthquake catalogs are especially vulnerable to pattern-seeking. A cluster in the news can feel like a global acceleration even when the statistical rate has not changed.
The largest earthquake in the September 8–15 window was a deep magnitude 6.5 event north-northeast of Teluknaga, Indonesia, at 21:23 UTC on September 11. USGS’s reviewed solution places it at a depth of 372 kilometers. The depth helped limit surface impact, and the agency assigned it a green alert level. (12)
One magnitude 6-class earthquake in roughly a week is not anomalous. From 2015 through 2025, the world averaged about 110 earthquakes of magnitude 6.0–6.9 per year—just over two per week. Short-term runs above or below that average are expected in a stochastic, clustered process. Better instruments and faster reporting also make modern seismic activity more visible without making the planet more active. (12)
Volcanic activity offers the same caution. Lewotolok in Indonesia continued to emit ash during early September and developed a new lava flow roughly 500 meters long. It was a real local hazard, not a marker of a global volcanic pulse. The Smithsonian Global Volcanism Program typically tracks 40 to 50 continuing eruptions, with about 20 volcanoes actively erupting on any given day. Its long-term assessment finds no evidence that global volcanic activity is increasing; much of the apparent historical rise reflects improved observation and reporting. (13)
These are not dismissals. Local earthquakes and eruptions can be catastrophic regardless of whether the global rate is unusual. The point is narrower: neither dataset supplies the independent anomaly needed to support a planet-wide disturbance during this interval.
A broader hypothesis deserves a harder test
There is a legitimate scientific question beneath the temptation to connect every outlier: could several seemingly separate planetary systems be responding to a common external driver?
That question becomes science only when it makes risky, testable predictions. Coincidence is not coupling, and a list of unusual observations is not yet a mechanism.
This week illustrates the central problem. Global air temperature, sea-surface temperature, marine heat waves, and El Niño are not four independent confirmations. They are different measurements of a tightly coupled ocean-atmosphere system. Counting them separately exaggerates the evidence. Meanwhile, the most useful independent controls—the Sun, the magnetosphere, seismicity, and volcanism—were either conventionally explained or statistically ordinary.
A credible common-driver hypothesis would need to specify, in advance:
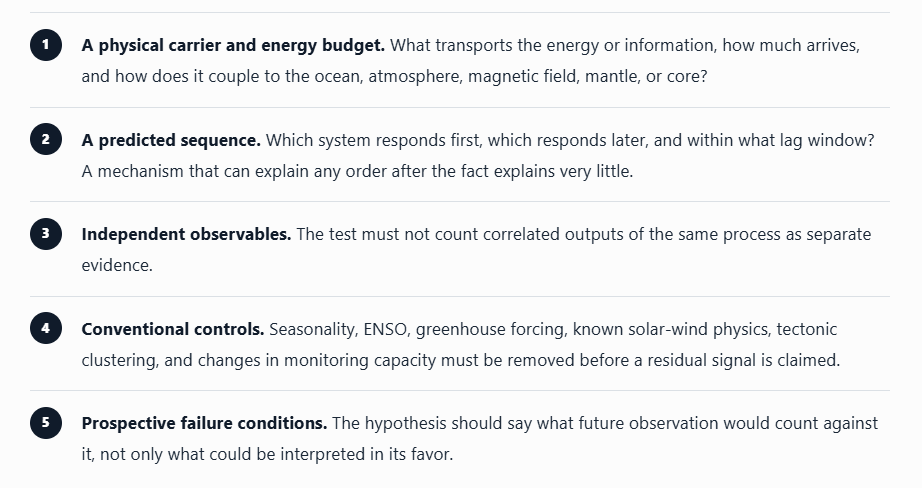
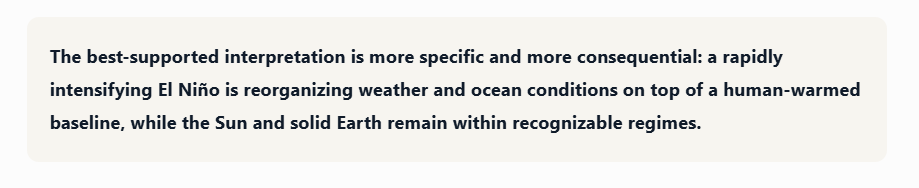
By those standards, the September 8–15 record does not show positive evidence of a common external energy stream driving the Sun and Earth together. It does not disprove every conceivable external influence. It does show that no such influence is required to explain the week’s observations.
What to watch now
The next decisive evidence will come from the Pacific itself: the persistence of subsurface heat, changes in the trade winds, the eastward movement of warm water, and the atmospheric response over the equator. NOAA’s late-year relative index will determine whether this event reaches territory not observed in the post-1950 record.
For the United States, the practical questions are regional. Does the southern storm track strengthen this winter? Where does drought retreat, and where does flood risk rise? How do marine heat waves affect fisheries, coastal ecosystems, and hurricane fuel? Those outcomes will emerge unevenly and will need attribution after observation, not before it.
Space weather, earthquakes, and volcanoes should continue to be monitored as independent systems, not recruited as supporting characters in an ocean-climate story. If they depart from their baselines in a coordinated and predicted way, that would be new evidence. This week, they did not.
The outlier was the ocean. The scientific task is to understand what that signal can explain—and to resist making it explain everything.
Method and primary sources
- Copernicus Climate Change Service: Surface air temperature for August 2026. Global air temperature, sea-surface temperature, marine heat waves, and sea-ice rankings.
- NOAA NCEI: Global climate report for August 2026. Independent global temperature and sea-surface analysis.
- NOAA NCEI: U.S. climate report for August 2026. Contiguous U.S. temperature and drought statistics.
- NOAA Climate Prediction Center: ENSO Diagnostic Discussion, September 10, 2026. Niño-region anomalies, subsurface heat, and forecast probabilities.
- World Meteorological Organization: El Niño outlook. Expected persistence and late-2026 peak.
- National Weather Service Honolulu: Hurricane Lowell event summary. Timing, wind gusts, and rainfall.
- Kauai Island Utility Cooperative: Lowell outage update. Customer outage totals.
- NOAA National Hurricane Center: 2026 Atlantic season summary. Storm counts and accumulated cyclone energy through September 14.
- Copernicus Atmosphere Monitoring Service: Indonesian seasonal fires. Observed intensification and El Niño risk context.
- NOAA Climate.gov: El Niño and La Niña FAQ. U.S. impacts, hurricane-basin effects, and heat redistribution.
- NOAA Space Weather Prediction Center: Weekly Highlights and Forecasts, issued September 14, 2026. Solar, geomagnetic, electron, and proton conditions. This is a rolling product.
- U.S. Geological Survey: M6.5 Indonesia event and global earthquake-rate statistics.
- Smithsonian Global Volcanism Program: Current eruptions, Lewotolok weekly report, and historical-activity FAQ.
Editorial note: All time-sensitive measurements and forecasts were checked against primary or authoritative institutional sources on September 15, 2026. Forecasts describe probabilities, not guaranteed outcomes. The hero image is an original editorial illustration; the two charts are original Pacific Outlier graphics based on the cited NOAA data.

