
On August 22, 2026, the global ocean reached a new daily temperature record. The number matters. But the timing may matter even more.
Concept illustration for Pacific Outlier. The temperature headline refers to Copernicus ERA5 daily SST averaged over 60°S-60°N, not every litre of the global ocean.
| Date: September 7, 2026 | Desk: Pacific Outlier Science & Complexity | Series: Planetary Watch |
Climate records have become dangerously easy to ignore. Another hottest month. Another marine heatwave. Another headline announcing something “unprecedented.” Eventually, the word loses force. So this first Planetary Watch begins with a more disciplined question: what exactly was measured – and what, if anything, makes it unusual?
The uncomfortable part is not the record
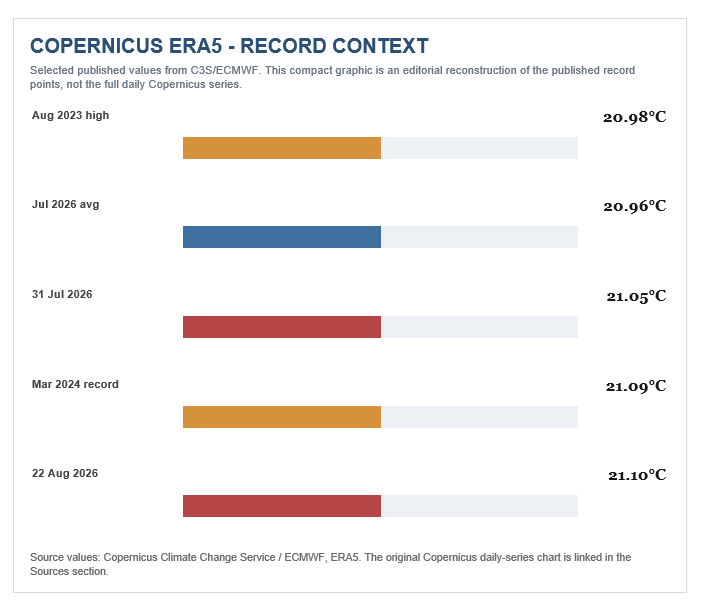
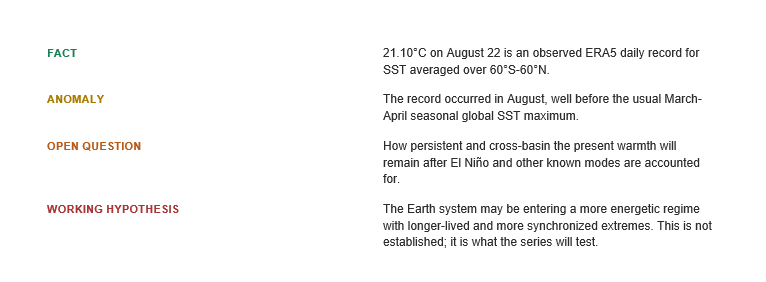
On August 22, the Copernicus Climate Change Service confirmed a daily average sea-surface temperature of 21.10°C across the extra-polar global ocean between 60°S and 60°N. That edged past the previous daily record of 21.09°C, set in March 2024. The ERA5 record used for this comparison begins in 1979, the satellite-rich period in which these estimates are considered most reliable.1
One hundredth of a degree sounds almost comically small. That is why the headline alone can mislead. A global average moves slowly; breaking the previous all-time level at all is the signal. More importantly, this record arrived in August.

Copernicus notes that the previous highest August daily value was 20.98°C in 2023. In other words, 2026 did not merely set a new August record. It pushed August above the old all-season record.1

First, a reality check
This is not evidence that “the oceans are boiling,” and it is not a direct measurement of every sea surface on Earth. ERA5 uses a reanalysis system and, for this indicator, estimates the ocean’s foundation temperature at roughly 10 metres depth. Different SST products, observing depths and processing methods can produce slightly different values.1
Nor does a single daily record prove that Earth has entered a fundamentally new physical regime. Weather matters. Ocean circulation matters. El Niño matters. Long-term greenhouse warming matters. Natural variability did not stop existing just because the baseline got warmer.
A record is an observation, not an explanation. That distinction is the entire point of this series.
El Niño is the obvious suspect – but there is a complication
On September 3, the World Meteorological Organization said El Niño was firmly established and expected to strengthen further. Its latest update gives a nearly 100% probability that the event will persist through February 2027.2
The companion WMO seasonal outlook is even more striking. For September-November 2026, the multi-model ensemble projects the Niño 3.4 SST anomaly at around +3.6°C, with intensification expected to peak around November-December.3

The timing matters again. This very strong El Niño is developing on top of an ocean that was already exceptionally warm. June 2026 produced the highest extra-polar SST recorded for that month at 20.86°C. July followed at 20.96°C, the highest July on record, and daily SST had been the highest for the respective date since June 19.4

Concept illustration. El Niño redistributes heat between ocean and atmosphere; it does not create energy from nothing.
But El Niño is not the whole story
The Pacific is central, but the warmth is not confined to one equatorial strip. WMO’s September-November outlook also expects a positive Indian Ocean Dipole around +0.9°C, while tropical Atlantic SSTs remain above normal.3
That does not mean all basins are being driven by one mysterious force. Established ocean-atmosphere modes can overlap. But it does mean that a simple explanation – “this is just one warm patch caused by El Niño” – is incomplete.
The more useful question is whether the anomalies remain persistent, synchronized and unusually widespread after the known modes of variability are accounted for.
37% of the ocean was already in a marine heatwave
NOAA’s Physical Sciences Laboratory estimates that 37% of the global ocean experienced marine-heatwave conditions in July 2026, ranking second among all months since 1991. Remove the long-term warming trend and the figure falls to 27% – but still ranks second.5
That detail is more revealing than a slogan. It prevents two convenient but opposite mistakes: “everything is just long-term warming” and “long-term warming has nothing to do with it.” The data point to a warmer baseline plus powerful shorter-term ocean dynamics.
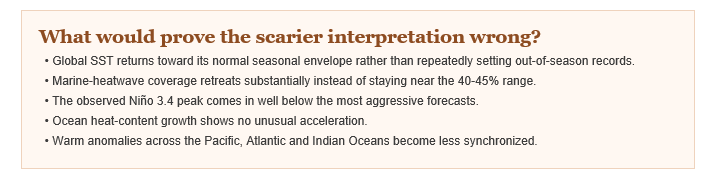
NOAA currently forecasts global marine-heatwave coverage could reach roughly 45% in boreal winter 2026-27, which would be the highest in the record beginning in 1991.5 Again, that is a prediction. We will judge it later.
The deeper test: is the ocean storing more heat?
Surface temperature is fast, visible and news-friendly. But the ocean is also the planet’s dominant heat reservoir. NOAA notes that the ocean stores roughly 90% of the excess heat in the Earth system, making ocean heat content one of the most important measures of the planetary energy imbalance.6
NOAA’s annual assessment found that 2025 set another record for upper-ocean heat content, the fifth consecutive year in which the annual value reached a new high.6
This is why Planetary Watch will not treat a future dip in SST as automatic evidence that the problem has gone away. Wind, mixing and upwelling can cool the surface while heat remains stored below. The slower 0-700 m and 0-2000 m heat-content series are therefore a more demanding test of whether the Earth system is continuing to accumulate energy.
And what would make the signal harder to dismiss?
Not one dramatic graph. Persistence.
If out-of-season SST records continue into late 2026, if the measured Niño 3.4 anomaly approaches the current WMO projection, if marine-heatwave coverage stays exceptionally high for months, and if subsurface heat content keeps pushing upward, the evidence for a broader change in the operating state of the ocean would become stronger.
That still would not prove an exotic mechanism. It would, however, justify asking whether the statistical regime itself is changing: not just warmer averages, but different persistence, clustering, cross-basin coherence and extreme tails.
Why Pacific Outlier is starting a weekly watch
We do not need another site where every flood is presented as proof of imminent collapse. We also do not need another site where every record is dismissed because “climate has always changed.” Both positions are too easy.
Planetary Watch will keep a running record of what was actually measured across the ocean, atmosphere, Sun-Earth environment, ice, drought, rivers, fires, major volcanic and seismic activity, and significant observations elsewhere in the Solar System. Most weeks may be ordinary. That is useful data too.
For Week #01, however, we have a clean starting marker:
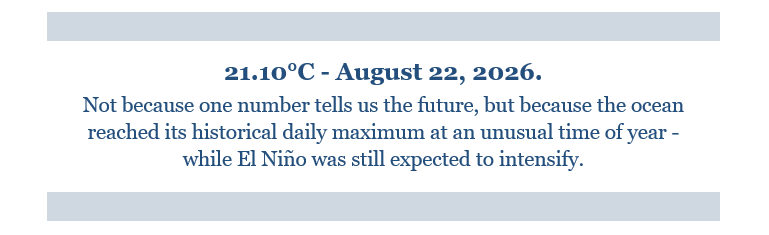
The question is no longer whether the record happened.
The question is what happens next.
PACIFIC OUTLIER – PLANETARY WATCH #01
Sources & verification
1. Copernicus Climate Change Service / ECMWF – Daily global sea surface temperature breaks 2024 record (24 Aug 2026)
Confirms 21.10°C on 22 Aug 2026, previous record 21.09°C in March 2024, unusual August timing, ERA5 60°S-60°N methodology and ~10 m foundation temperature.
2. World Meteorological Organization – El Niño/La Niña Update (August 2026), published 3 Sep 2026
Confirms El Niño is firmly established and near-100% persistence probability through February 2027.
3. WMO – Global Seasonal Climate Update for September-October-November 2026
Multi-model ensemble forecast: Niño 3.4 seasonal mean anomaly ~+3.6°C for SON 2026; positive IOD ~+0.9°C; tropical Atlantic above normal.
4. Copernicus – July 2026 climate bulletin
July extra-polar SST 20.96°C, highest July on record; daily SST highest for each respective day from 19 June through July; 31 July reached 21.05°C.
5. NOAA Physical Sciences Laboratory – Marine Heatwave Forecast Monthly Report, Aug 2026 initialisation
July 2026: 37% [27% detrended] global MHW coverage, second among all months since 1991; forecast to reach 45% in boreal winter 2026-27.
6. NOAA National Centers for Environmental Information – Annual 2025 global climate assessment
Upper-ocean heat content reached a record high in 2025; fifth consecutive annual record; ocean stores about 90% of excess Earth-system heat.
https://www.ncei.noaa.gov/news/global-climate-202513

Editorial note & disclosure. This article separates observed measurements, statistical anomalies, unresolved questions and working hypotheses. Forecasts are labelled as forecasts. Concept artwork is AI-assisted editorial illustration and is not presented as observational imagery. Scientific claims are linked to primary or near-primary institutional data sources so readers can verify them independently.

